We're concerned when it's cold – kicking up the snow to reveal the soil below for the hungry-looking European Robin during a walk in late February, and thinking about Cetti's Warblers, European Stonechats and Eurasian Wrens in the weeks and months that follow. We eagerly await the arrival of migrant species – predicting what will be back 'on patch' at the weekend and remarking on anything out of the 'norm'. We can't help it – it's these questions that keep birding so fascinating! So far, 2018 has provided us with lots to talk about, but is there cause for concern?
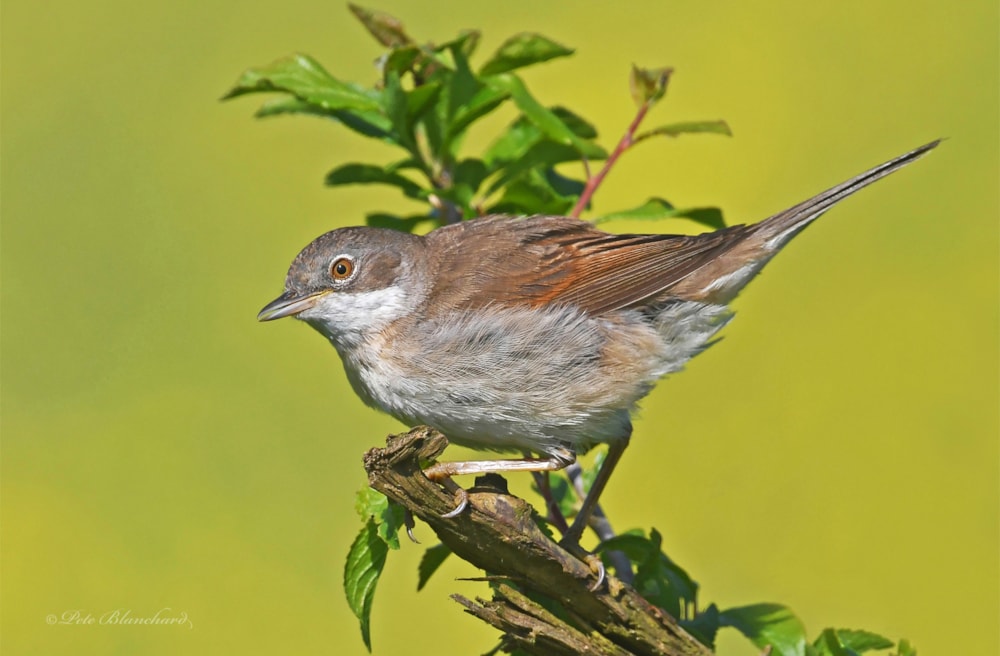
Social media would suggest that Common Whitethroat is enduring a very poor year so far in 2018 (Peter Blanchard).
The BirdTrack reporting rate graphs are certainly keeping many of us interested here at the British Trust for Ornithology (BTO) HQ – comparing hearsay with the graphs to see if this year's records are on par with the historic reporting rate. Do the numbers look below average? Did migrants return late?
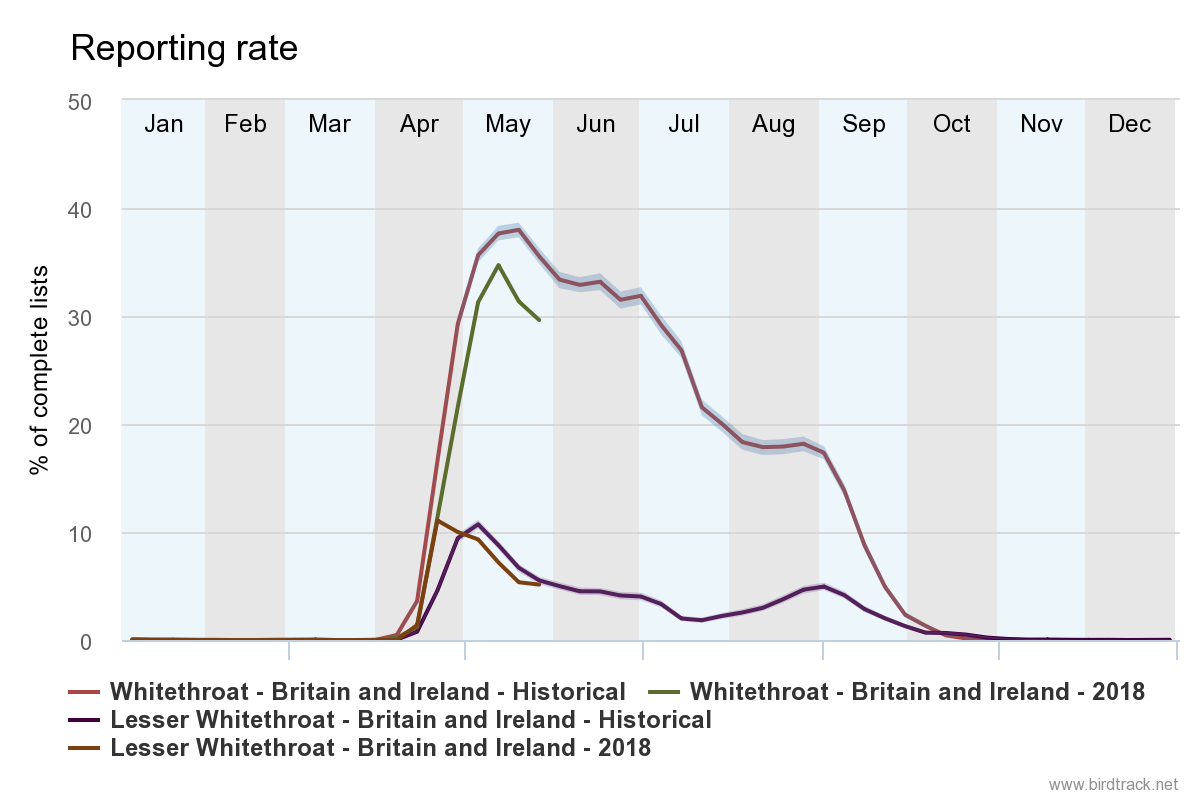
Here in south-east England at least, it felt as though Common Whitethroats were pipped to the post by Lesser Whitethroats. A quick glance at the BirdTrack reporting rate for England shows that the two arrived around the same time, but Lesser returned with a vengeance, whereas Common is below the historic average in terms of reporting rate. Might this change, though? It's possible that Common Whitethroats are still filtering in quietly and getting on with the business of nesting, meaning they are less detectable by song. Lesser Whitethroats could be settling down to breed earlier, with reports decreasing as a result in recent weeks – the peak looked on average, but the whole pattern looks a week or so earlier than 'normal'.
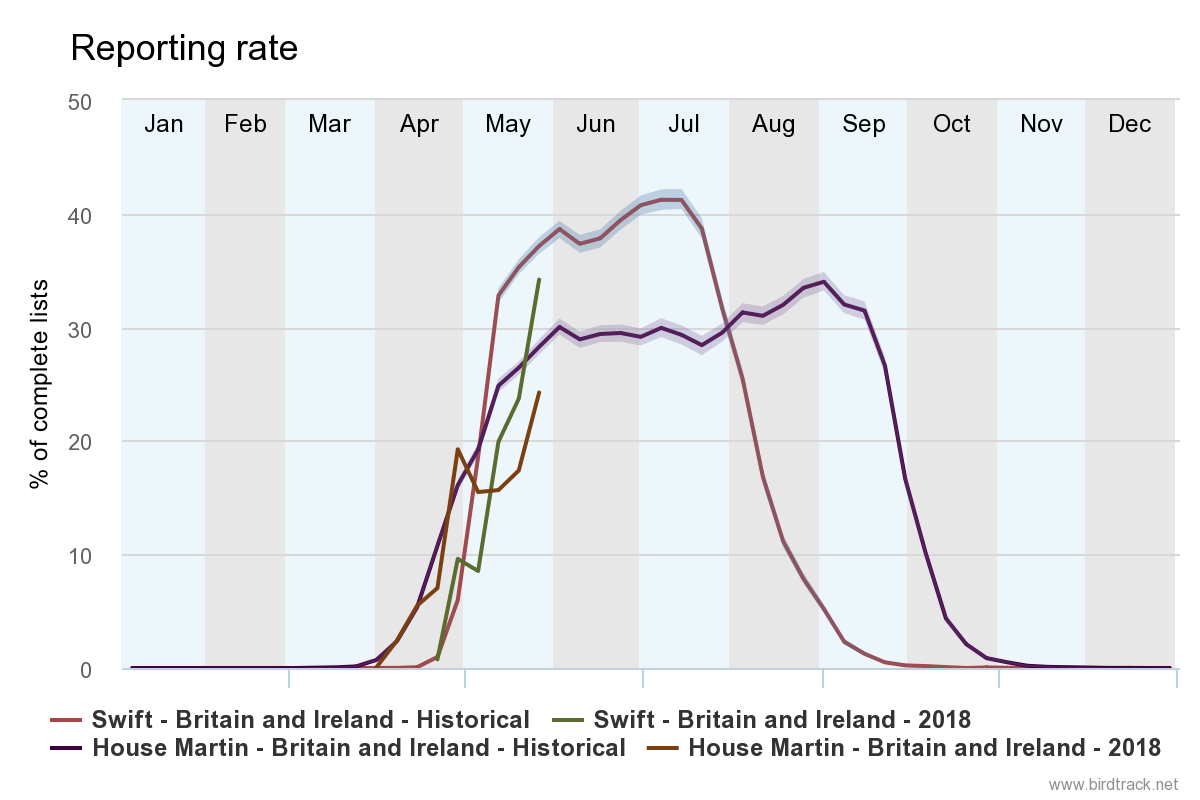
The consensus on social media is that House Martins and Common Swifts are back, but in much lower numbers than previous years. Is this reflected in data collected using complete lists in BirdTrack? On the latest UK-wide House Martin graph from BirdTrack all looked to be going fine, but the last fortnight shows the reporting rate to be well down on the historic average. Is swift late or down on previous years? Only the data can reveal this.
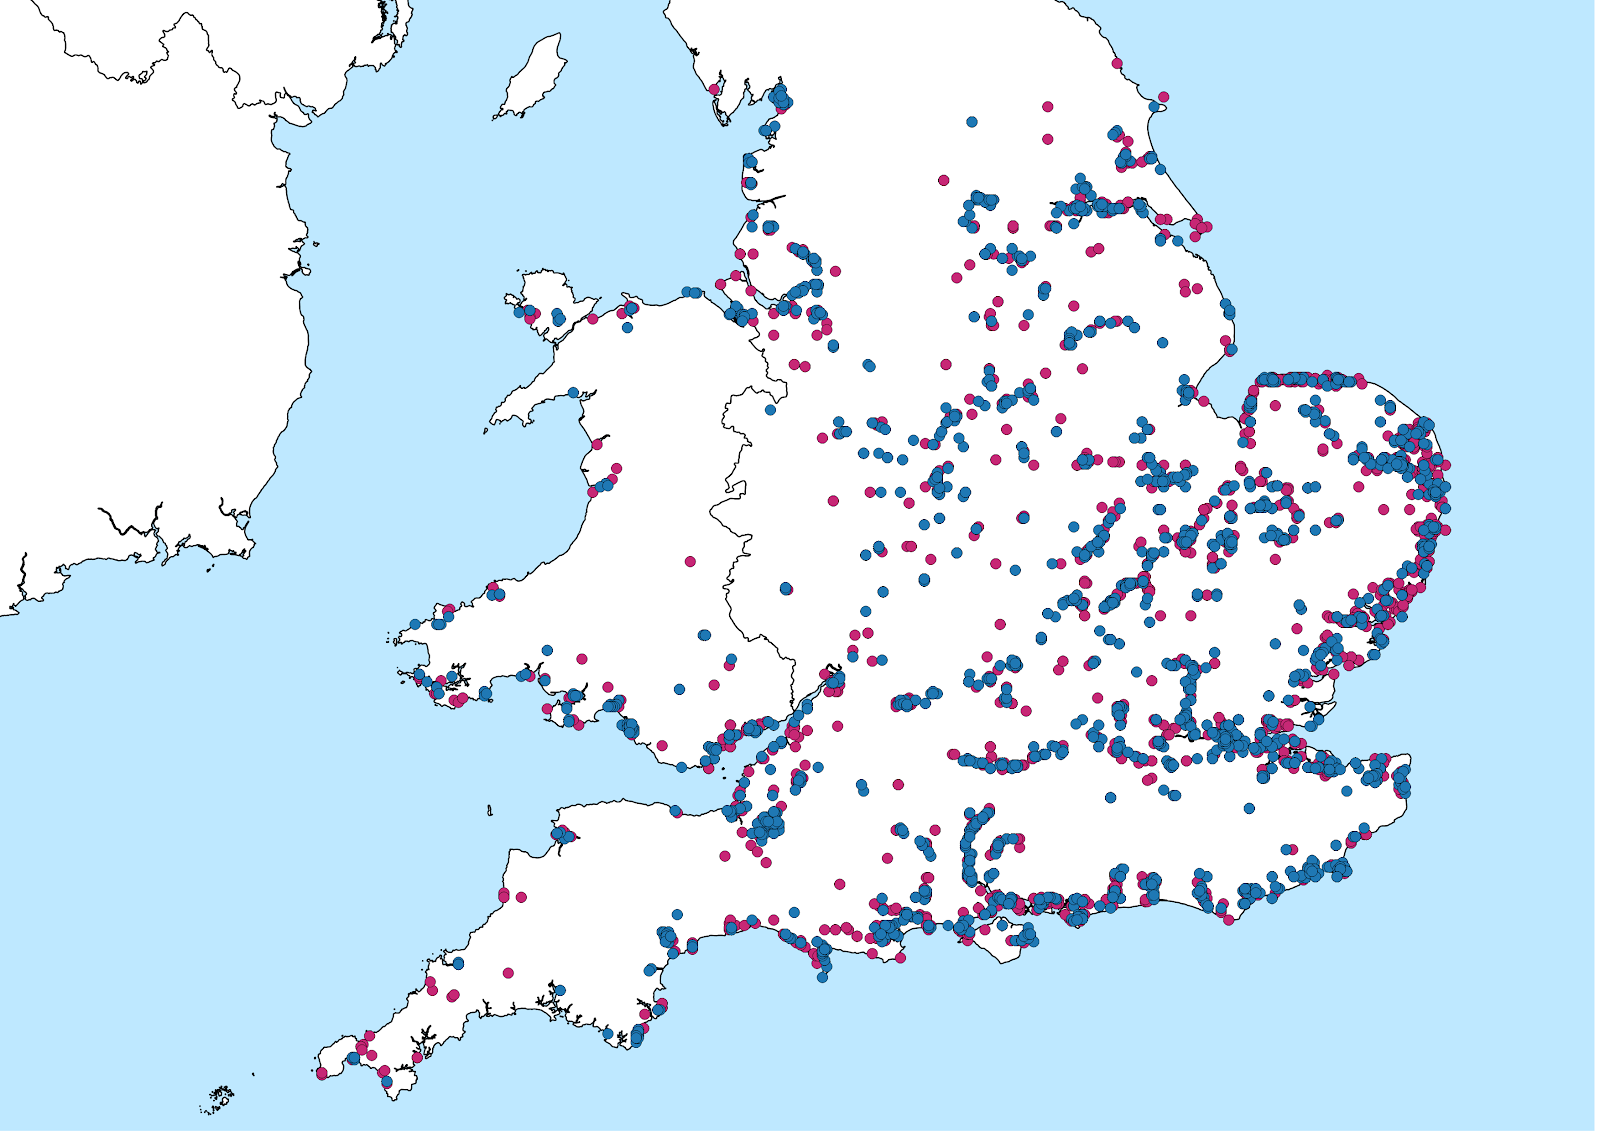
With a UK decline of 59 per cent revealed by the BTO/JNCC/RSPB Breeding Bird Survey (BBS), over the last 21 years, Common Nightingale is often at the fore of people's minds in spring, especially for birders lucky enough to have a local breeding pair. The distribution map of BirdTrack records for 2018 (blue) so far illustrate regional variation from 2017 (pink), with birds not being reported as far north and west as in 2017, and several sites reporting a decline in numbers or even a total absence.
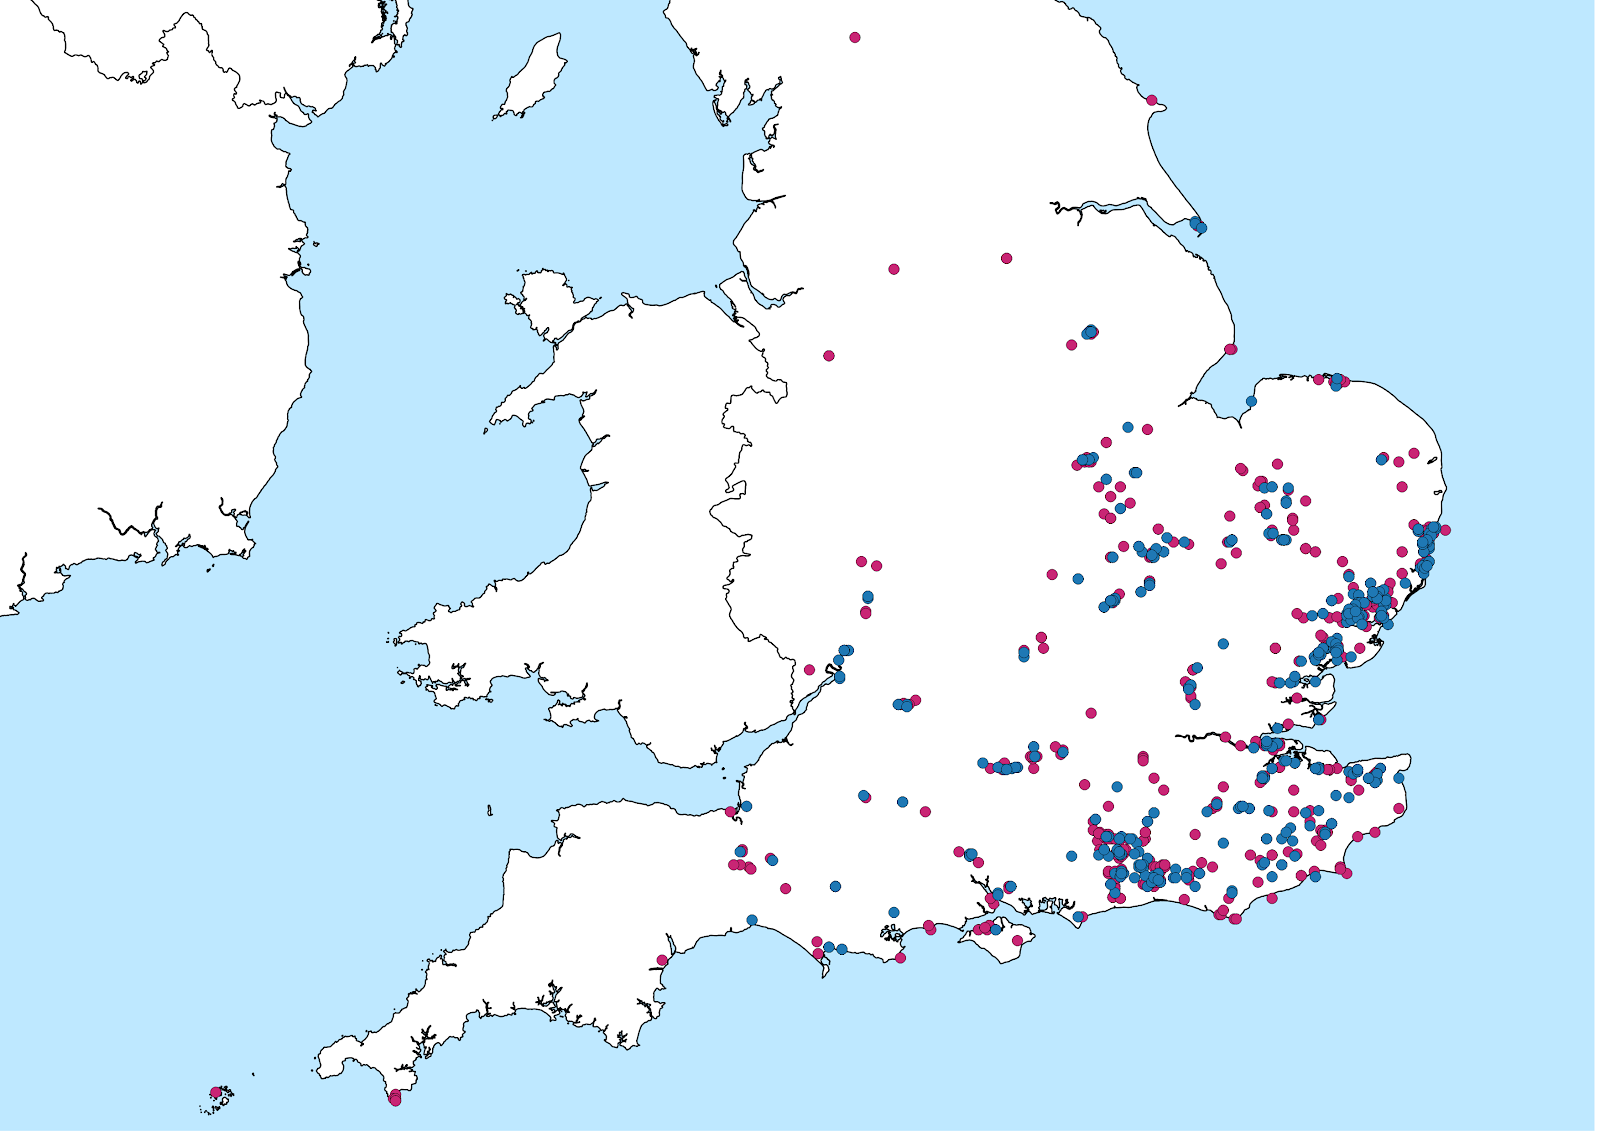
Distribution map for Common Nightingales in 2018 (blue) compared to 2017 (pink).
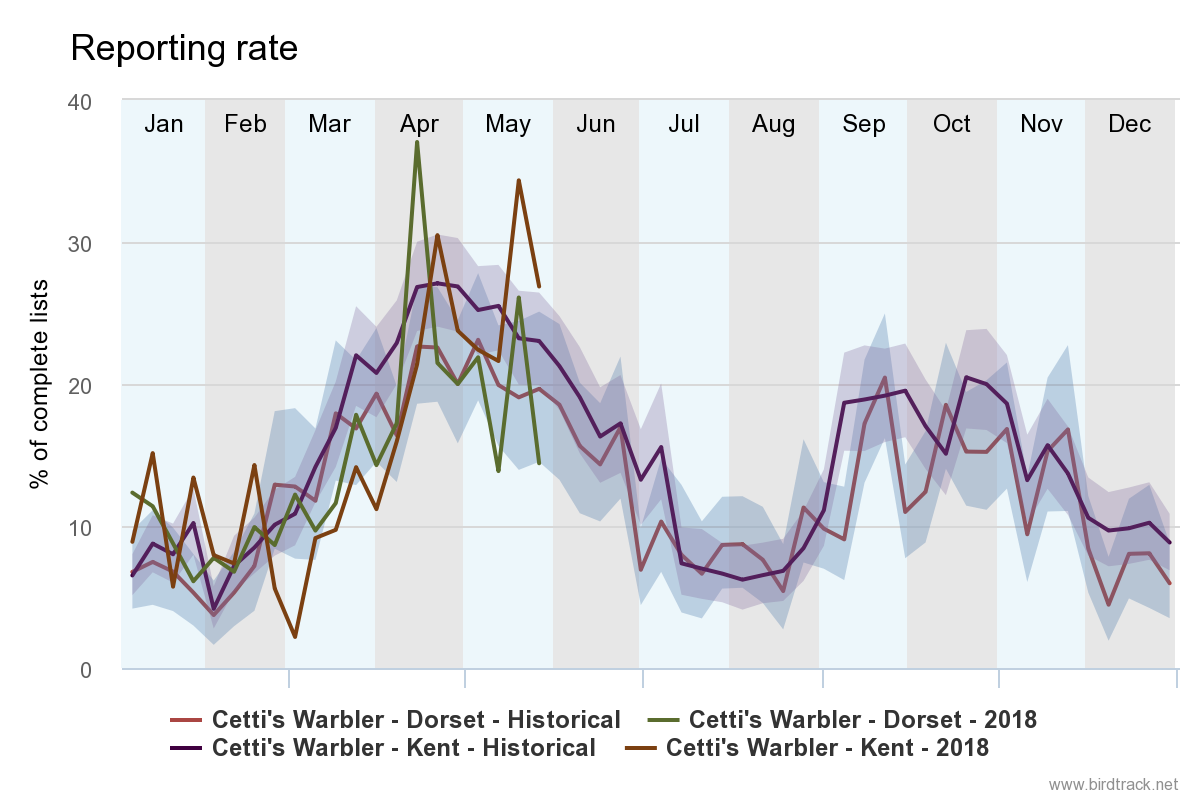
Continuing the theme of localised variation, BirdTrack data for some of our resident birds suggest the so-called 'Beast from the East' may have had more of an impact in some areas than others. A BirdTrack distribution map for Cetti's Warbler records covering 2017 (pink) and 2018 (blue) indicate that there has not been a significant reduction in distribution as a result of the cold weather. The reporting rate graphs, however, suggest that abundance in some areas has been affected. For example, Kent shows a significant drop in the reporting rate in late February and March, with reports slowly increasing back toward the historical average in April. The reporting rate from Dorset for the same period doesn't show a large drop in reporting rate around the time the cold weather gripped the UK – could a difference of just a day or two of harsh weather have influenced the resulting reporting rates for some of our resident species?
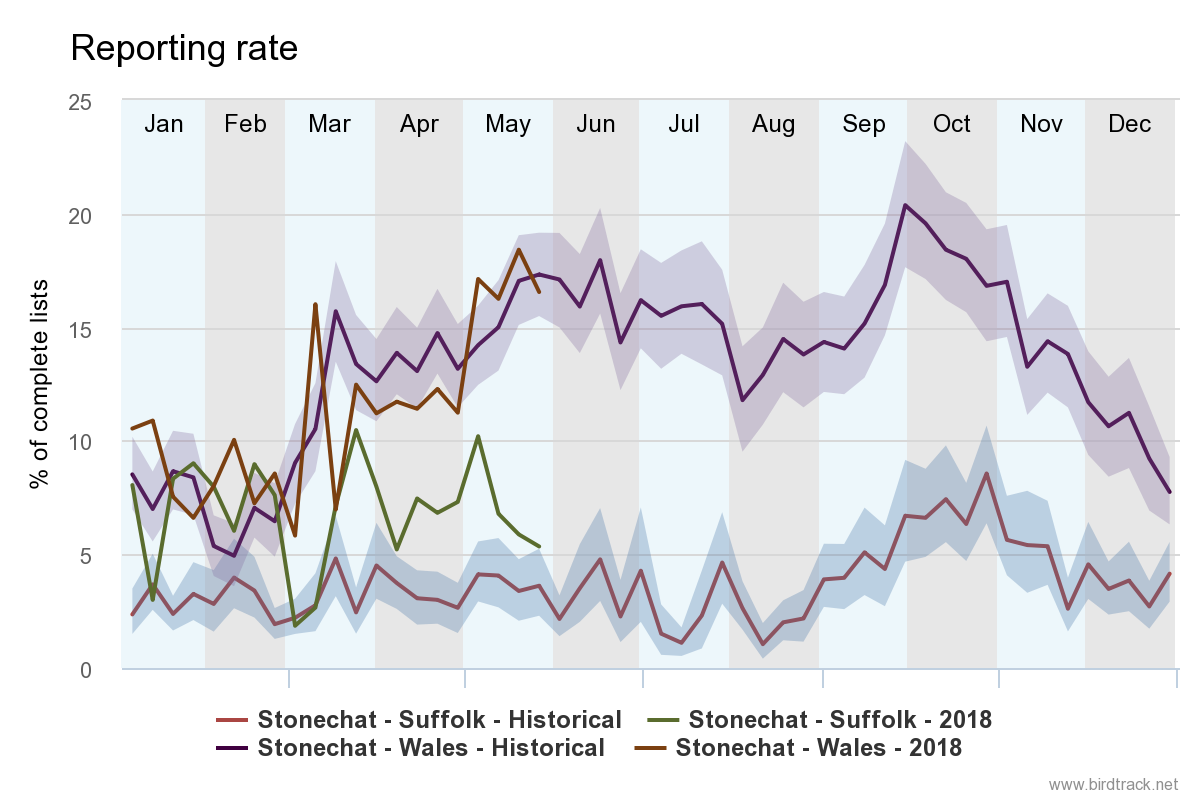
European Stonechats show a similar reduction in reporting rate in the east of England as Cetti's Warbler but, interestingly, after a couple of weeks of low reporting, bounced back and returned to levels above the historical average. Stonechats in Wales look to have been less affected by the freezing conditions brought on by the harsh weather.
All in all, early signs are concerning for some species, but there is only one way to find out how both our commoner resident and migrant species have fared between 2017 and 2018: the Breeding Bird Survey (BBS) results. Published a couple of months earlier in 2018 than previously, it is hoped the 2017-18 year-on-year trends will be released in early 2019, once data have been entered for the current year, checked and trends calculated (which takes more than a month to do!). These should provide some interesting reading.
BirdTrack is a fantastic (and addictive) early warning system but requires further manipulation and additional data from which to draw conclusions. However, the BBS produces trends for 117 common bird species, and as of 2017, this includes five- and 10-year trends, along with the all-time (21-year) trends, where sample size allows. These shorter-term trends have resulted in the sample size for Cetti's Warbler reaching the reporting threshold and with particular relevance here, a year-on-year trend which we will be racing to see when the 2018 BBS report is published. For now, do take a read of the recently published 2017 BBS report, available online at www.bto.org/bbs-report.
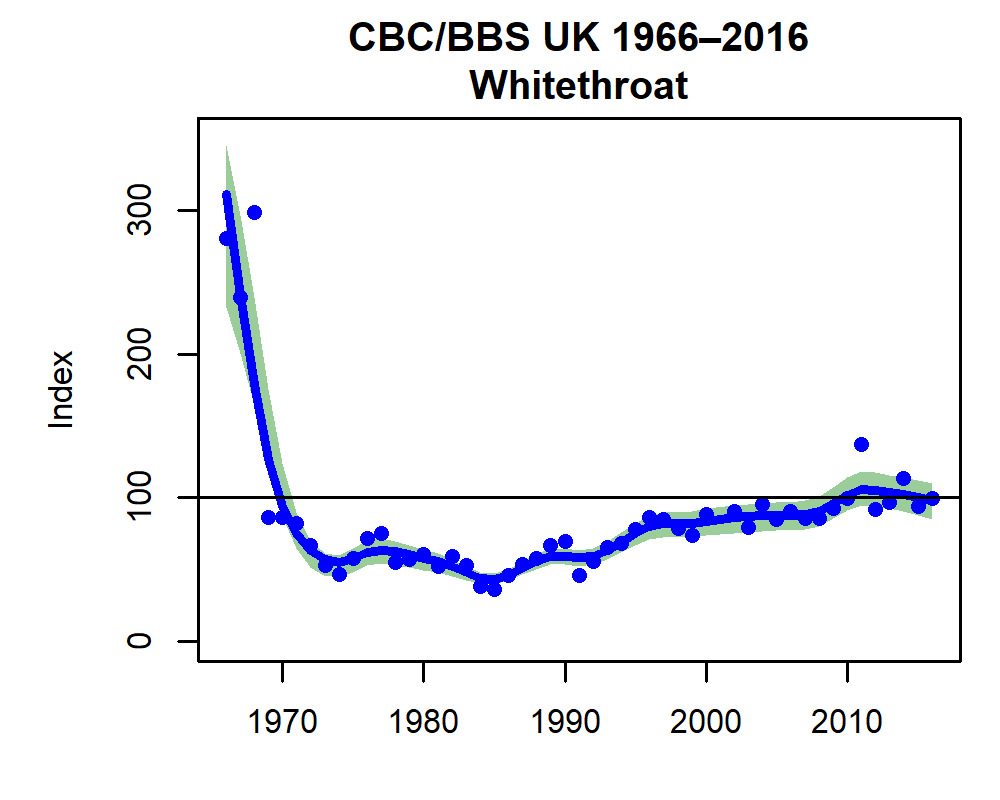
A good example of what BBS or rather its predecessor the Common Birds Census, can show us comes from way back during the winter of 1968-69, when the UK's Common Whitethroat population plummeted by 70 per cent. Research linked this crash to drought in the species' wintering grounds in the western Sahel, just south of the Sahara. What will the 2018 BBS report tell us about the 2017-18 winter for both resident and migrant birds?
Despite the hints from BirdTrack, feelings from birders in the field and trends from BBS, the results won't tell us why some species did well over winter and others did not – we can only leave that to further speculation!
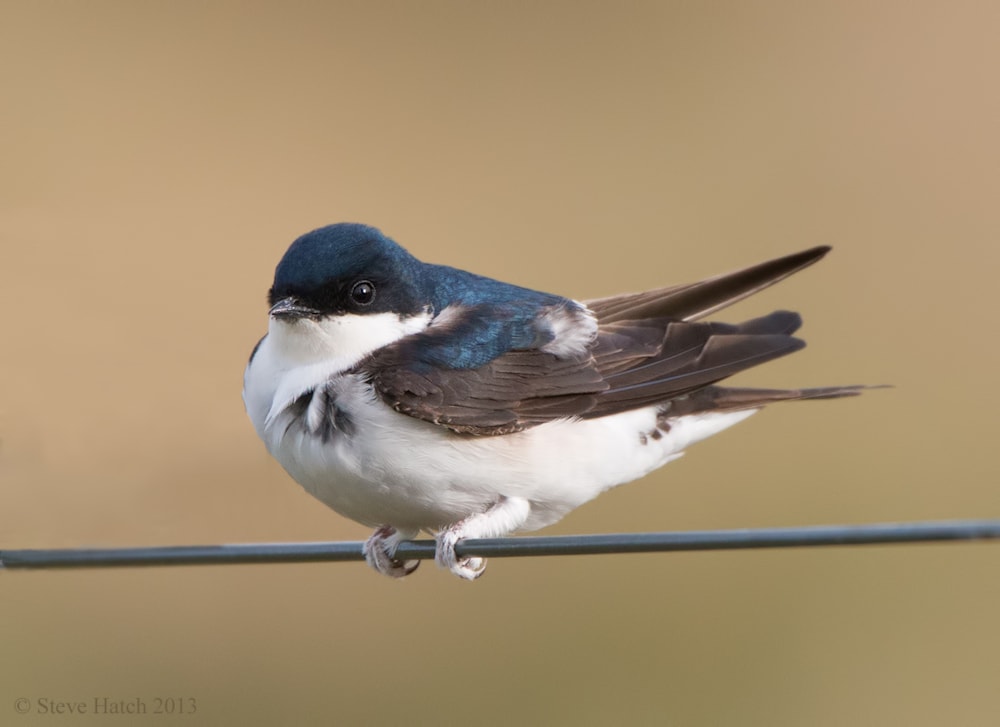
So far this spring, the BirdTrack report rate of House Martin has been well down on previous years (Steve Hatch).
The importance of data
The above illustrates the importance of data collection, both via BirdTrack and BBS – not just for seeing changes in reporting rates and trends, but also for associated research, often examining the 'whys' and 'whens' behind population changes. This& is only possible when we have this kind of data stockpiled.
Here are some ways you can get involved.
BirdTrack: the scheme relies on your lists: simply make a note of the birds you see or hear, either out birding or from the office or garden, for example, and enter your observations on a simple-to-use web page or via the free app for iPhone and Android devices. BirdTrack records migration timings and distributions of birds throughout Britain and Ireland, as well as globally, and your records can be submitted year-round and from any country. For those new to birding, it is possible to contribute records of species you are 100 per cent confident in the identification of as casual records, and as your birding progresses or as experienced birders, you can enter 'Complete Lists' whereby every single bird seen or heard during a birding trip is submitted. Complete Lists are particularly useful because the proportion of lists with a given species provides a good measure of frequency of occurrence that can be used for population monitoring, as seen in the graphs in this article. You can add other valuable information like breeding evidence too, which is particularly helpful for county bird recorders and the Rare Breeding Birds Panel. BirdTrack provides facilities for observers to store and manage their own personal records as well as using these to support species conservation at local, regional, national and international scales.
BirdTrack is a partnership between the BTO, the RSPB, Birdwatch Ireland, the Scottish Ornithologists' Club and the Welsh Ornithological Society.
Breeding Bird Survey: this survey is a national volunteer project aimed at keeping track of changes in the breeding populations of common bird species in the UK. The survey involves two early morning spring visits to a local, randomly selected, 1-km square to count all the birds you see or hear while walking two 1-km lines across the square. We need skilled volunteers who can identify the birds they are likely to encounter on their square by both sight and sound. For full details, visit the BBS Taking Part pages and contribute to the calculation of bird trends for 117 bird and nine mammal species and help us keep tabs on their population changes.
The BTO/JNCC/RSPB Breeding Bird Survey is a partnership jointly funded by the BTO, RSPB and JNCC, with fieldwork conducted by volunteers. The Breeding Bird Survey (BBS) now incorporates the Waterways Breeding Bird Survey (WBBS).
No comments:
Post a Comment